Dotplot
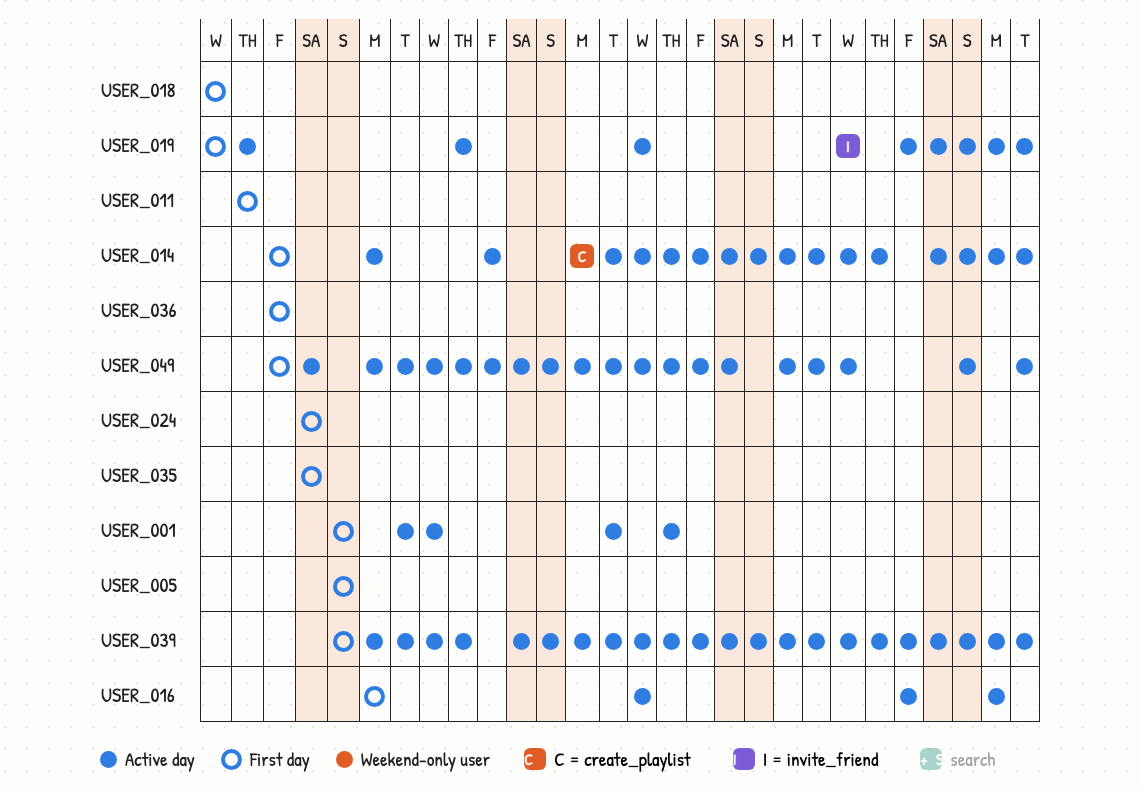
One row per user, one dot per active day — ask Claude, get your aha moment.
Set up Dotplot (MCP + skills) — instructions are here https://dotplot-reports.vercel.app/setup.md
for Claude Code & Cursoropen source (MIT)no signup, no SDK
your data never leaves your machinestats computed by Python, not the LLM
1
Install
Paste the line above to Claude — it installs the server and the slash commands. No signup, no SDK.
2
Say this
"Analyze my product"
Claude finds your data, runs the analysis, and hands you the report.
What you get in ~3 minutes:
💡 your aha moment
📉 where new users drop off
📈 weekly retention
🕐 change since last report
🌍 any language